 |
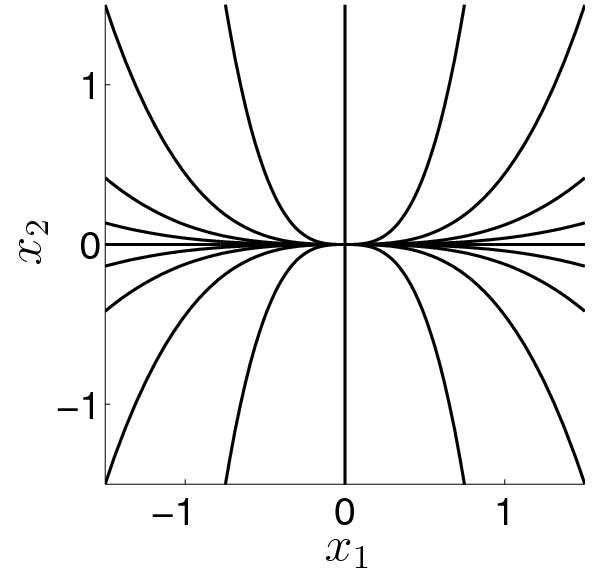
	hold on
	for phi=0:2*pi/20:2*pi,
	  x0 = 3*[cos(phi);sin(phi)];
	  t = 0:0.05:10;
	  xt = [exp(-t)*x0(1); exp(-3*t)*x0(2)];
	  h = plot(xt(1,:),xt(2,:),'k');
	end
	axis(1.5*[-1,1,-1,1]); axis square
|
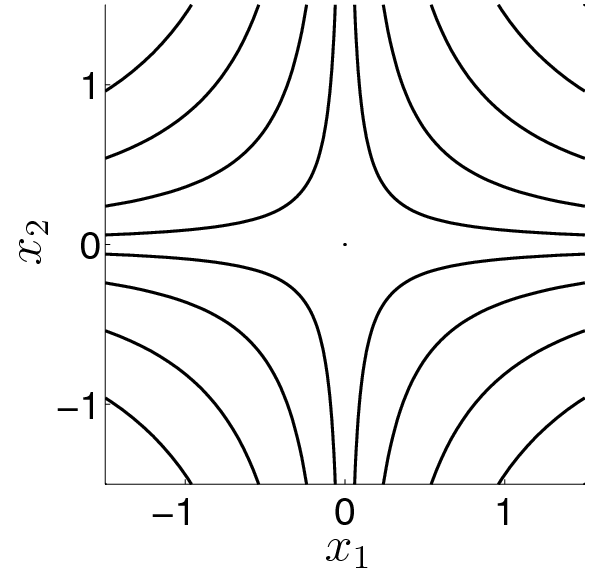 |
	hold on
	for phi=-1.5:3/10:1.5,
	  x0 = [phi;-phi];
	  t = -10:0.05:10;
	  xt = [exp(-t)*x0(1); exp(t)*x0(2)];
	  h = plot(xt(1,:),xt(2,:),'k');
	  x0 = [phi;phi];
	  t = -10:0.05:10;
	  xt = [exp(-t)*x0(1); exp(t)*x0(2)];
	  h = plot(xt(1,:),xt(2,:),'k');
	end
|
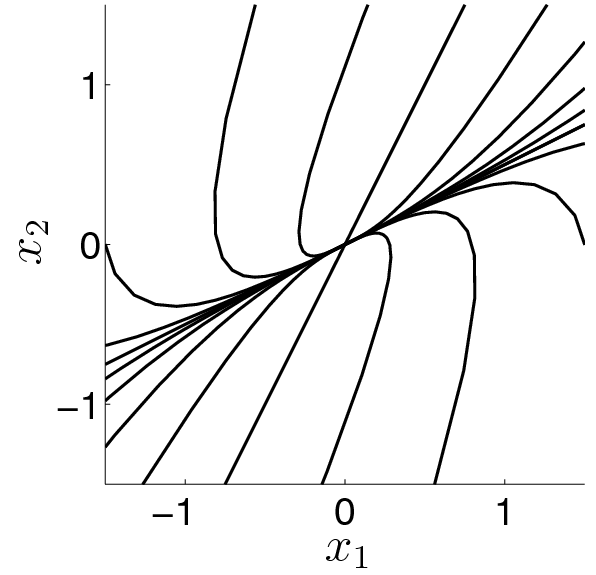 |
	hold on
	V=[1 0.5; 0.5 1];
	for phi=0:2*pi/20:2*pi,
	  x0 = 3*[cos(phi);sin(phi)];
	  t = 0:0.05:10;
	  xt = V*[exp(-3*t)*x0(1); exp(-9*t)*x0(2)];
	  h = plot(xt(1,:),xt(2,:),'k');
	end
	axis(1.5*[-1,1,-1,1]); axis square
|
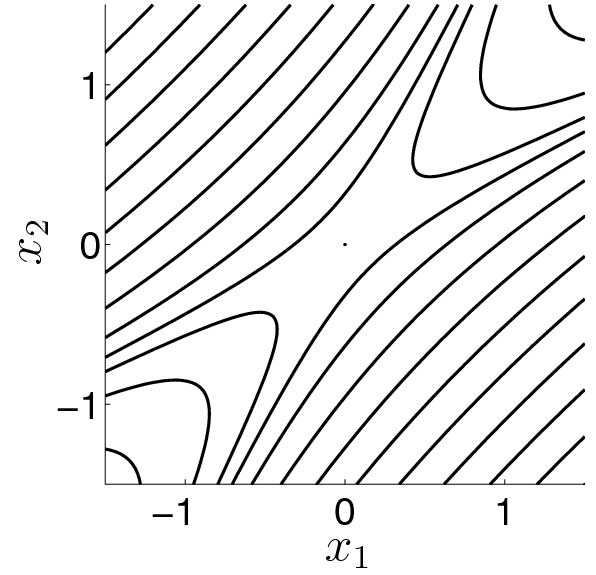 |
	hold on
	V=[1 0.5; 0.5 1];
	for phi=-3:3/10:3,
	  x0 = [phi;-phi];
	  t = -10:0.05:10;
	  xt = V*[exp(-t)*x0(1); exp(t)*x0(2)];
	  h = plot(xt(1,:),xt(2,:),'k');
	  x0 = [phi;phi];
	  t = -10:0.05:10;
	  xt = V*[exp(-t)*x0(1); exp(t)*x0(2)];
	  h = plot(xt(1,:),xt(2,:),'k');
	end
|
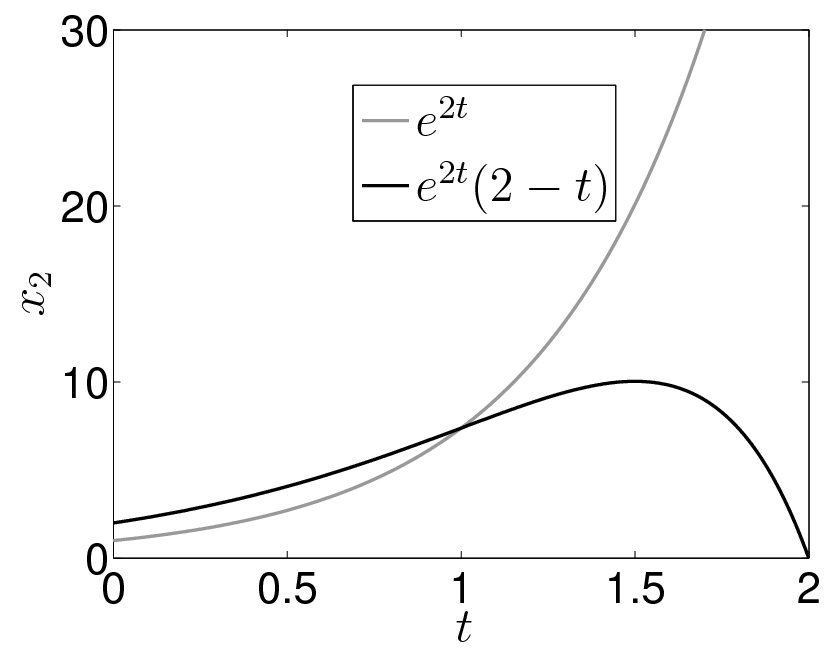 |
	t=linspace(0,2,1000);
	a=2;
	x=exp(a*t).*(2-t);
	h = plot(t,exp(a*t),'color',[0.6 0.6 0.6]);
	hold on;
	h = plot(t,x,'k');
	axis([0 2 0 30])
	h = legend('exp2t','exp2t(2-t)')
	set(h,'location','best')
|
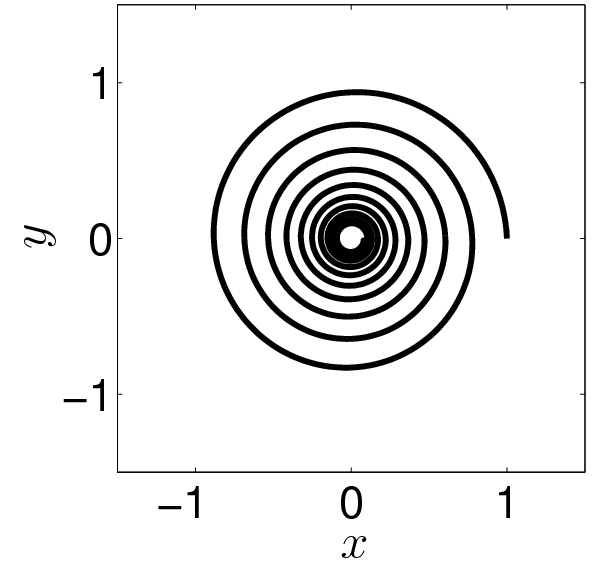 |
	t = 0:0.05:20*pi;
	xt = exp((-0.04 + i)*t);
	% bzw. exp(i*t); bzw. exp((0.04 + i)*t);
	h = plot(real(xt),imag(xt),'k');
	axis(1.5*[-1,1,-1,1]); axis square
|
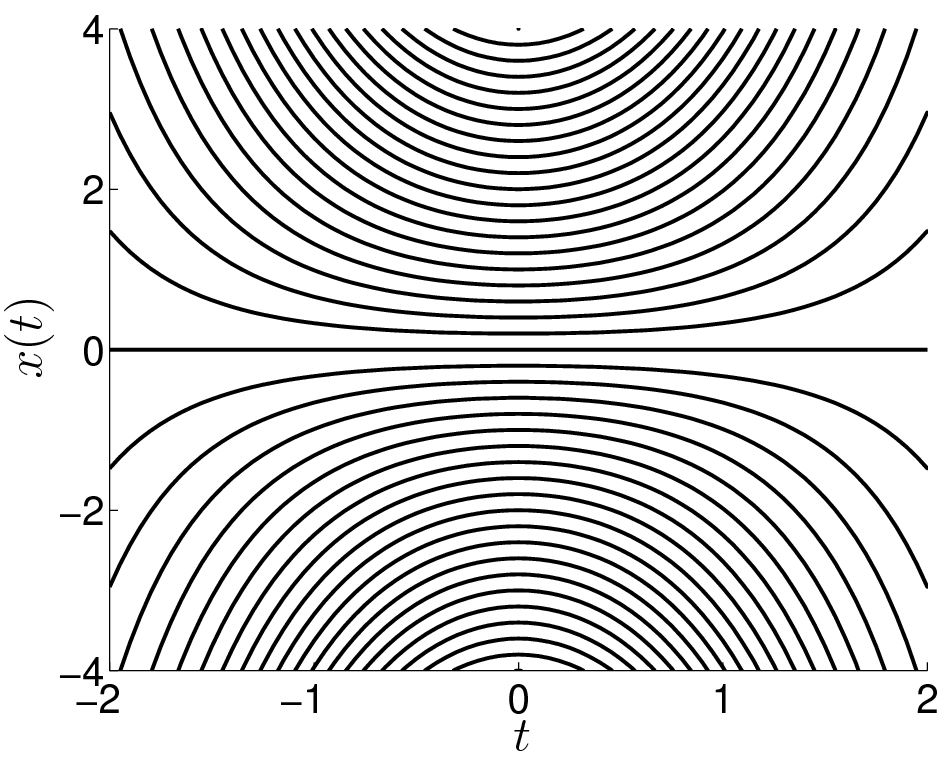 |
	t = -4:0.05:4;
	xt = diag([-4:0.2:4])*repmat(exp(t.^2/2),41,1);
	h=plot(t,xt,'k');
	axis([-2,2,-4,4]);
|
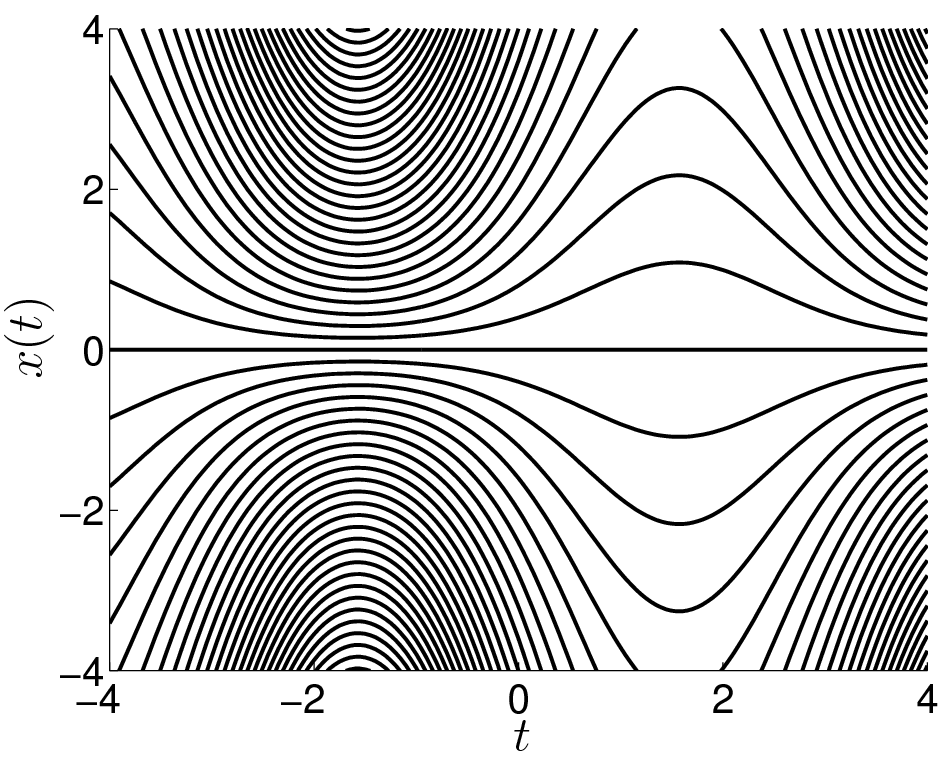 |
	t = -4:0.05:4;
	xt = diag([-12:0.4:12])*repmat(exp(sin(t)),61,1);
	h=plot(t,xt,'k');
	axis([-4,4,-4,4]);
|