 |
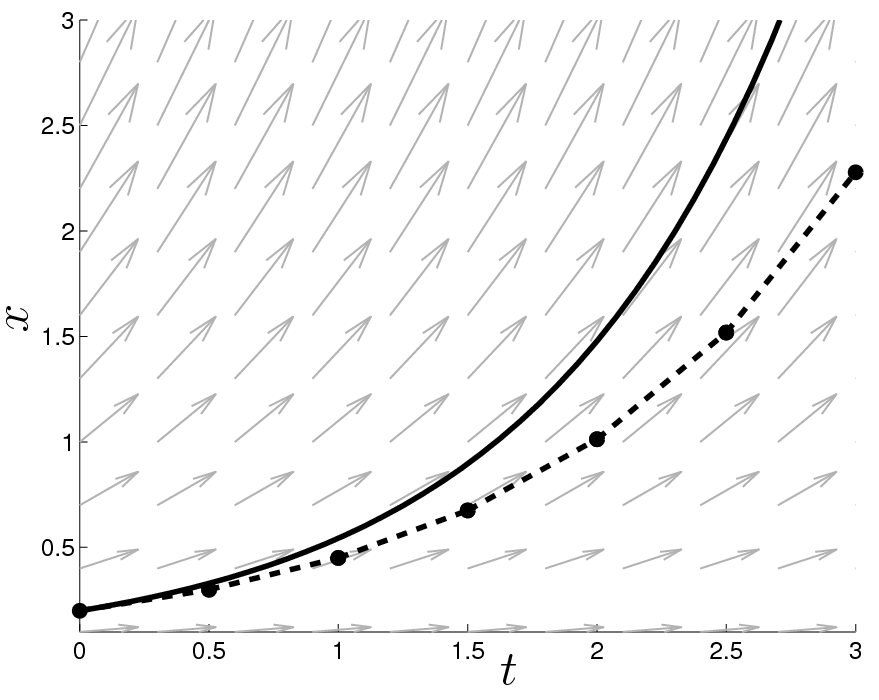
	[x,y] = meshgrid(0:0.3:3,0.1:0.3:3);
	u = ones(size(x)); v = y;
	h = quiver(x,y,u,v,1.75);
	axis([0 3 0.1 3]); 	hold on;

	f = inline('x','t','x');
	x0 = 0.2; T = 3;
	[t,x] = ode45(f,[0,T],[x0]);
	plot(t,x,'k-','linewidth', 3);

	x1 = x0; t1 = 0;
	h = 0.5
	for i=1:T/h
	  t2 = t1+h;
	  x2 = x1 + h.*f(t1,x1);
	  plot([t1,t2],[x1,x2],'k--o','linewidth', 3);
	  x1 = x2; t1 = t2;
	end;
|
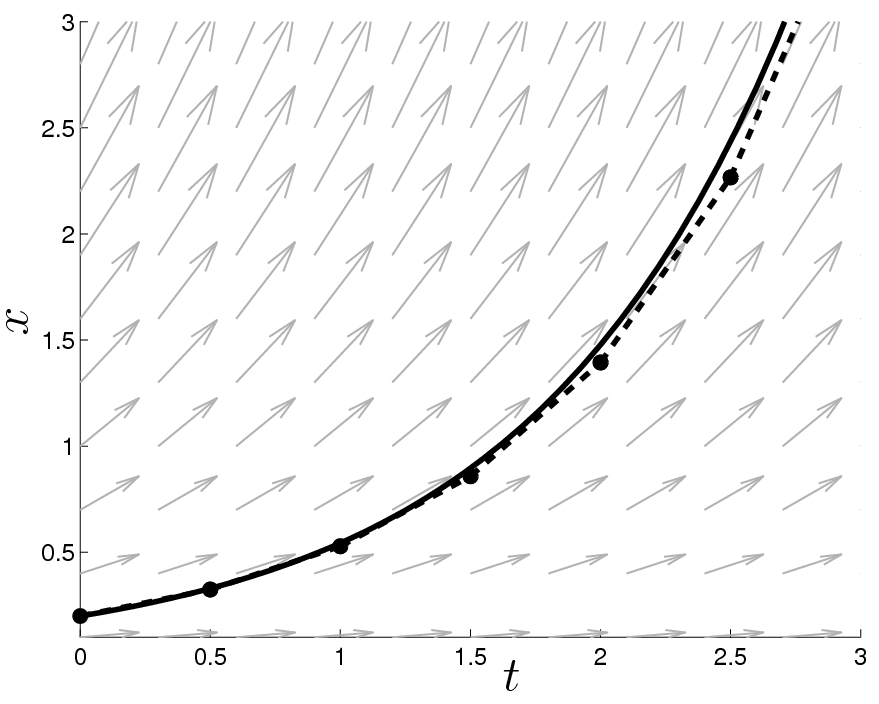 |
	[x,y] = meshgrid(0:0.3:3,0.1:0.3:3);
	u = ones(size(x)); v = y;
	h = quiver(x,y,u,v,1.75); hold on;

	f = inline('x','t','x');
	x0 = 0.2; T = 3;
	[t,x] = ode45(f,[0,T],[x0]);
	plot(t,x,'k-','linewidth', 3);

	x1 = x0; t1 = 0;
	h = 0.5
	for i=1:T/h
	  t2 = t1+h;
	  k = f(t1,x1);
	  x2 = x1+h./2*(k+f(t1+h,x1+h.*k))
	  plot([t1,t2],[x1,x2],'k--o','linewidth', 3, 'MarkerFaceColor', 'k');
	  x1 = x2; t1 = t2;
	end;
|
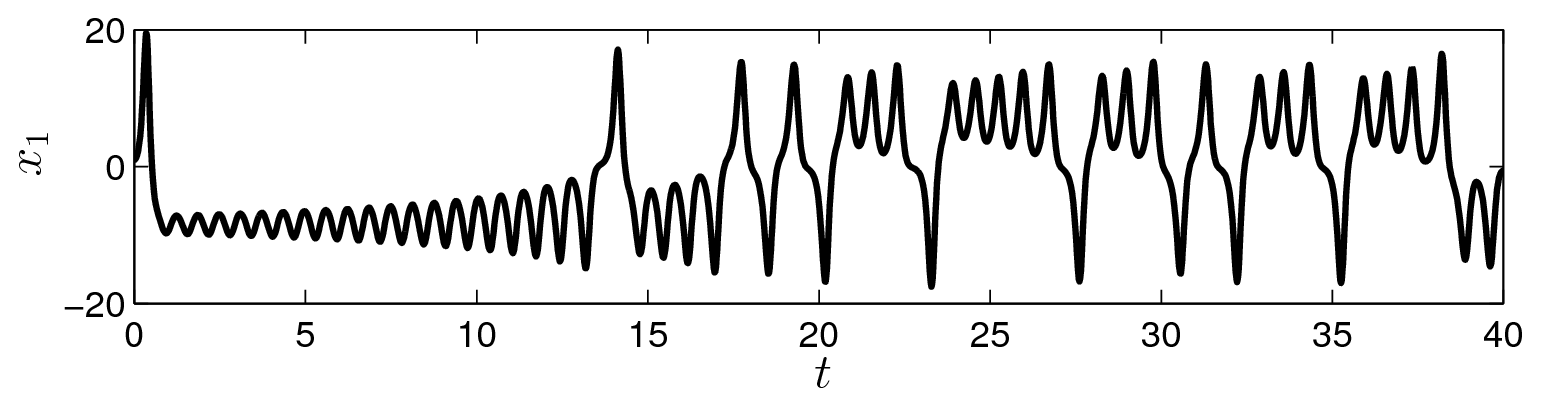 |
	sigma = 10; beta=8/3; rho=28;
	dgl = inline('[10*(x(2)-x(1));
				   28*x(1)-x(2)-x(1)*x(3);
				   x(1)*x(2)-8/3*x(3)]','t','x');
	opt = odeset('RelTol',1e-5,'refine',1);
	x01 = [1;1;1];
	[t1,x1] = ode45(dgl,[0,40],x01,opt);
	h = plot(t1,x1(:,1),'k'); set(gca,'plotboxaspectratio',[1 0.2 1])
|
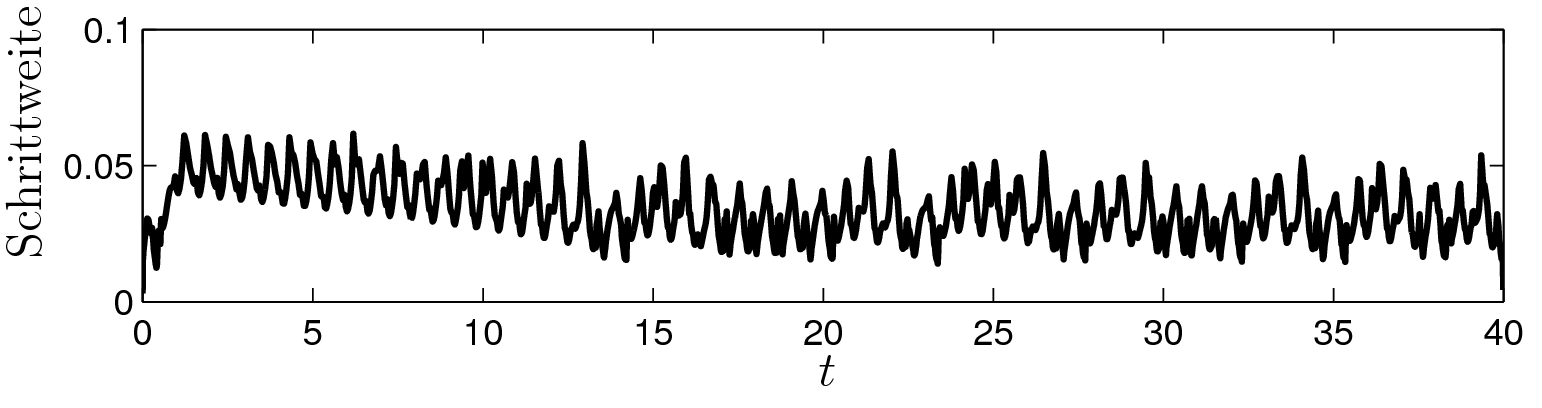 |
	dt = t1(2:size(t1))-t1(1:size(t1)-1);
	h2 = plot(t1(1:size(t1)-1),dt,'-k');
|
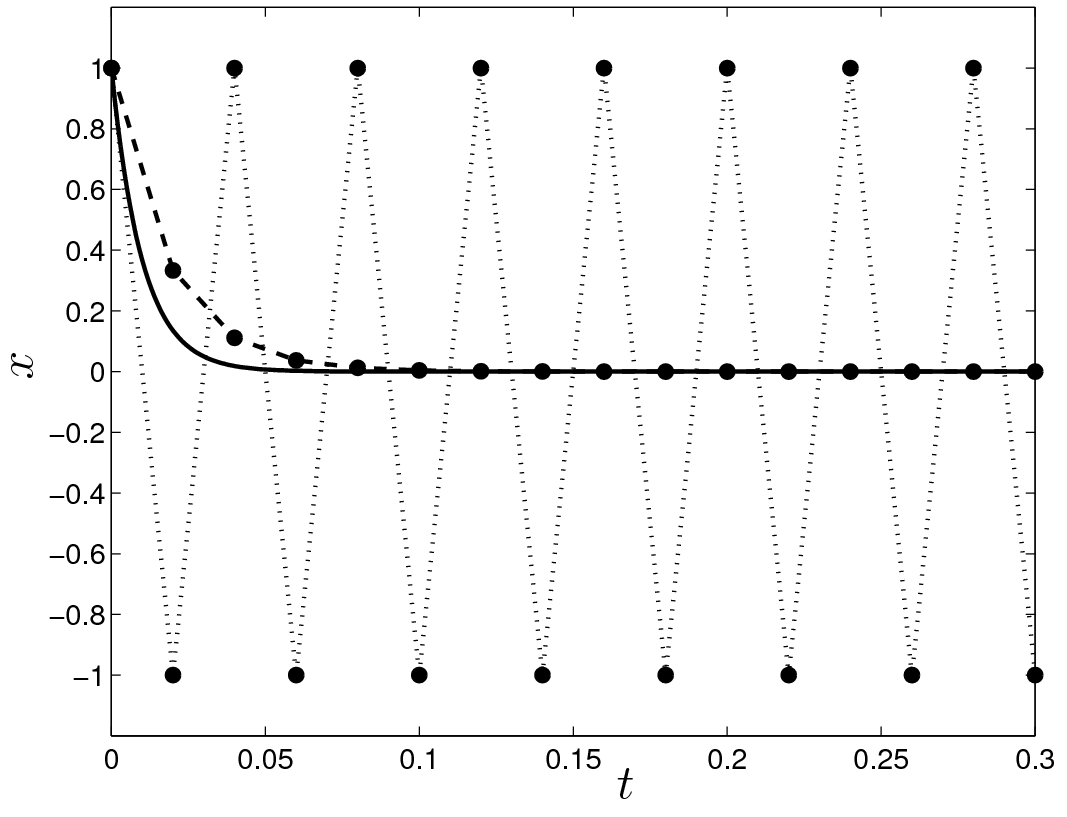 |
	lambda = -100;
	T = 0.3;
	ttex = [0:0.001:T];
	exakt = exp(lambda.*ttex);
	h1 = 0.02;
	tt = [0:0.02:T];
	exeu1 = (1+h1*lambda).^(tt./h1);
	impeu1 = 1./((1-h1*lambda).^(tt./h1));
	plot(ttex,exakt,'k-',tt,exeu1,'k:o',tt,impeu1,'k--o',...
	    'linewidth',2,'MarkerFaceColor','k');
	axis([0,T,-1.2,1.2]);
|